
Every marketer worth their salt should want their marketing efforts to work to drive conversions. However, it can be difficult to know whether you're spending your time and budget promoting the right marketing content on the correct channels.
This is where one of the most important tools in your portfolio comes into its own: the attribution report. If you aren't already using it, then now is the time to make a start. This simple report could really help to streamline your operations.
What are attribution reports?
Most marketers who are familiar with Google Analytics will typically use the Keyword Planner or Ad Preview tools and ignore the sections concerning attribution.
However, to do this is to rule out a really great tool. Once you've set up conversion tracking as a way of working out where your leads are coming from, you'll already have access to a set of reports that give you insight into consumer behavior on your website.
According to Google Analytics, the attribution tab "shows how many conversion events were driven by each source and ad network".
In layman's terms, the tool creates reports that can be used to understand the journey a customer takes from finding your site to making a purchase - also referred to as measuring the conversion path - to highlight what made them make a decision.
By using attribution reports, marketers can quantify each traffic source's contribution to sales and conversions, pinpointing the exact marketing effort that led a buyer down that funnel to part with their money.
Source LunaMetrics
With this information, marketers can make more informed decisions about where their budget should be going to further boost conversions.
It's important to mention here that different credit will be given to different marketing efforts depending on what type of attribution report you decide to run, while the attribution model chosen will determine how the score is calculated.
Learn more: How to Marry Your Google Analytics and Your Attribution Model
Where can you find attribution reports?
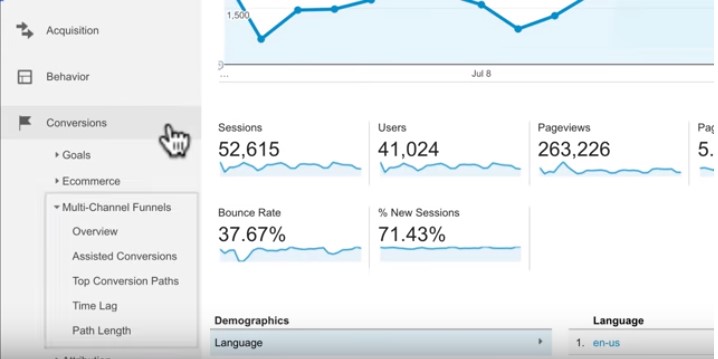
It's easy to find attribution reports. Simply open your AdWords account in Google Analytics, click on the 'Tools' tab and select 'Attribution'. You may also have a configuration with the wrench tool icon. If this is the case, click on it and then select 'Measurement' and 'Search Attribution'.
 Source Google
You'll then see a series of reports that can be clicked on to discover more about clicks and conversions.
Don't forget that it's essential to have goals or transactions reported into Google Analytics first and to be using campaign tags for all of your inbound marketing, including having AdWords linked up if you're using it.
What do you need to know about attribution reports?
There are a number of fascinating data sets to look at once you start analyzing your attribution reports, so let's take a look at a few you might want to start with.
1. Attribution overview
This is a great starting point, as it tells you how many conversions you received and how many days and ad impressions it took for those people to convert. This can give you insight into your path lengths.
2. Assisted conversions
This report will tell you how many conversions your advertising assisted with and can be ideal for working out which keywords are really working. It might be that they helped with plenty of awareness but weren't previously showing up as the last click. Consequently, increasing investment in them may boost conversions.
3. Cross-device activity
In our ultra-connected, multi-platform era, a device path report is essential in showing you when customers interacted with you and on what devices. For instance, you may discover that most conversions go from tablet to desktop to mobile, allowing adjustments to be made on campaigns for particular devices and extra spending to be placed on mobile platforms where you now know people are choosing to convert.
4. Top paths
This one will show you the most common paths buyers take. It can help marketers with attribution modelling, for instance, if single-interaction paths crop up and there is less need to be concerned about assisting campaigns losing credit.
Once you have your reports, you can continue to adjust the filters on them to build a better picture of your marketing efforts. You might want to take a look at bounce rates, new visitor sessions, average session lengths or a number of other factors, for example, to zoom in on exactly what is having an impact on conversions.
What should I do with attribution reports?
Fresh supplies of data can be daunting, but using them could be a real asset to streamlining your marketing budget.
To get started, begin with a clear goal in mind - such as viewing how display advertising impacted incremental conversions - as opposed to trying to jump right in and analyze everything.
It's also a good idea to identify your most important marketing metrics, whether that’s marketing spend or total attributions, and then use them across all reports to standardize your approach and help you make the best optimization decisions.
For example, you could use your attribution reports to take a look at how many leads are generated by a blog post by checking how many times it was viewed before conversion. It's also possible to see which pages on a website are being viewed the most before someone enters the sales funnel, which can be enlightening if they aren't the pages you expected.
This can help you learn which content on your site can be capitalized on and further optimized for better chances of conversion. Remember that a 'test and learn' approach is essential as you start to experiment with what works best for your data and your business goals - and that you shouldn't see something that doesn't work as a failure, but as a chance to run another test.
5 questions you'll want to answer with an attribution report
It's a good idea to approach attribution reports with certain key questions in mind, so you can increase your chances of gaining relevant, useful conclusions from the information available.
Here are some of the questions you'll be able to answer with a detailed attribution report:
1. How long does it usually take for customers to convert?
Working out the amount of time customers typically take to complete their buying journey can be particularly useful when it comes to refining your marketing strategy and optimizing conversion rates.
Attribution reports can give you lots of valuable information in this area. For example, examining your average path length in Google Analytics will show you how many steps your customers tend to take on their way to converting. This could highlight potential areas for improvement or greater efficiency.
Another useful metric is time lag, which can show you how long it took for someone to become a customer after they first saw one of your ads or logged onto your website.
2. How often do people use various devices on their conversion path?
Conducting a detailed analysis of your attribution reports can help you improve your audience understanding by building up a more thorough picture of customer behavior.
One of the specific things you can learn is how many different devices people use on their journey to completing a conversion. Google's cross-device activity reports show when users interact with multiple ads before becoming customers, but also when they do so on multiple devices.
This can prove particularly useful for planning when and in what channels you can expect to see the highest levels of engagement with your customers.
3. Which marketing channels generate the most leads?
Detailed attribution reports can show you not only what types of content are proving most useful for generating leads, but also which channels are the most productive.
You can view a statistical representation of the various paths people take to conversion, broken down into the various channels that comprise your marketing mix, from organic and paid search to display ads, social media and email newsletters.
Findings from this will inform your future strategy and investments. If, for example, you discover that your social media advertising is generating a high proportion of leads while email is underperforming, it’ll teach you something about which channels your customers prefer and the sort of content they find most appealing.
4. How many leads come from blogs?
Your blog can be one of the most valuable weapons in your marketing arsenal, but it's a resource that can take some time, attention and investment to get into good shape.
For that reason, you want to have a clear, data-driven idea of how effectively your blog is yielding leads and driving conversions.
The customer journey paths provided by attribution models can show you how often blog posts are viewed immediately before a conversion. This is invaluable information if you want to demonstrate ROI from your blog, or if you feel this aspect of your marketing needs a change in strategy to deliver better results.
5. Which pages are viewed the most before conversions?
Blog posts, landing pages, product listings and special offers have a vital part to play in driving conversions, but it's important to remember that there are many other types of pages that can help you turn leads into customers.
Attribution modelling offers the detailed information you need to ascertain whether certain pages that might not usually get much marketing attention - your 'about us' section, for instance - are contributing to conversions.
Are brands using attribution reports?
According to Econsultancy's second State of Marketing Attribution report, published in association with AdRoll, the use of attribution is going up.
The number of businesses implementing attribution on 'all or most' of their marketing activities increased from 31% in 2016 to 39% in 2017.
However, 70% said they struggle to act on attribution insights, perhaps because they are boggled by the new data.
If your business can successfully implement attribution reports and, even more importantly, learn from their findings to make better marketing decisions, then you could find yourself rising above the competition and ensuring more of your leads turn into conversions.
Access the latest business knowledge in Marketing
Get Access


Marketing Insights for Professionals
Insights for Professionals provide free access to the latest thought leadership from global brands. We deliver subscriber value by creating and gathering specialist content for senior professionals


Comments
Join the conversation...